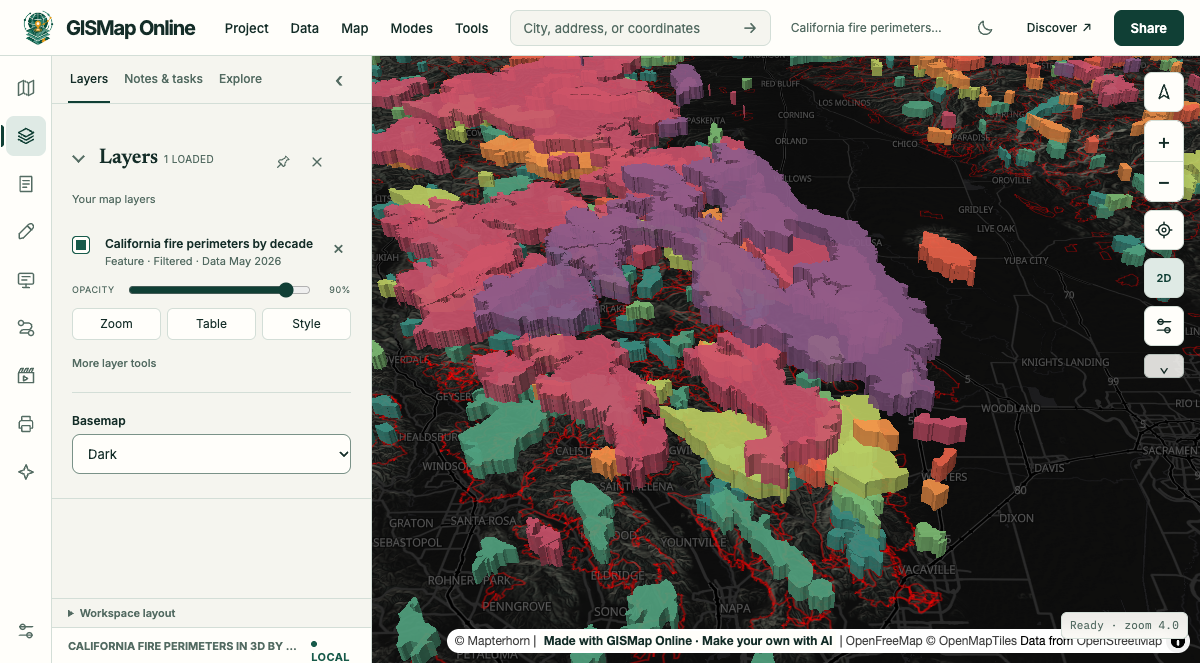
A 3D strata map lifts overlapping shapes into stacked slabs, one level per group: a decade, a year, an event or a category. Where shapes overlap, the slabs pile up, so places that change, burn or flood again and again rise into tall stacks you can read at a glance.
California fires of 1,000 acres or more since 1950, stacked by decade with the 1950s at the bottom. Source: CAL FIRE historic fire perimeters.
How it works
Three settings make a strata map.
Group the shapes
Choose a field with a few ordered values, such as a decade, a year or a severity class (40 groups at most). Each group gets its own level, lowest value at the bottom. Reverse the stacking order to put the highest at the bottom instead.
Size the slabs
Set the slab thickness, the slot separation between levels and the gap between them. Heights are display distances that keep levels apart; they are not real altitudes. A number field can set each slab's thickness instead.
Colour and play it
Pick a palette or a colour per group under Slab colours. In Cinematic mode, the Strata effect drops each step's shapes onto the stack as the timeline plays, building the history up in order.
Change over time
Shapes that move, grow or shrink.
Strata suit any boundary recorded more than once, where the change is in the shape itself.
Environment
Glaciers and ice
Ice extent by survey year. A retreating glacier reads as a stepped, shrinking stack.
Water
Lakes and reservoirs
Surface extent by year, so drought drawdown and recovery show as layers.
Coasts and rivers
Shorelines and channels
Shoreline or river channel positions over time, for erosion and channel migration.
Cities
Urban growth
City limits or annexations by decade, or built-up area by period.
History
National territory
Borders and territories through time, showing what was held, lost and regained.
Census
Boundaries between censuses
Tract or district boundaries by census year, or redistricting plans side by side.
Land
Deforestation
Clearing by year, such as Brazil's PRODES polygons, showing where loss spreads.
Ecology
Ranges and outbreaks
Species ranges or disease outbreak zones by period, showing shifts and spread.
Infrastructure
Service coverage
Broadband or transit service areas by year, showing where coverage arrived first.
Repeated events
Places hit again and again.
When the same ground is affected by many events, the stack height shows how often it happened.
Hazards
Wildfires
Fire perimeters by decade or year. Places that burn again and again build tall stacks. This is the example below.
Hazards
Floods
Inundation extent by event, picking out the places that flood repeatedly.
Hazards
Hurricanes
Wind swaths or forecast cones by storm or by advisory.
Hazards
Drought
Drought areas by year (filter weekly maps to a few dates; a chart holds 40 groups at most).
Hazards
Earthquakes
Strong-shaking areas by event, showing where shaking overlaps.
Categories and real layers
Not only time.
Groups can be categories instead of dates. Stacked footprints show how many layers cover a place; real layered things keep their natural order.
Stacked footprints
Overlapping districts
School, water, fire and tax districts stacked by type, showing how many cover each place.
Stacked footprints
Hazard zones by severity
Flood return periods (100-year, 500-year) or sea-level-rise scenarios (1 ft, 3 ft, 6 ft).
Stacked footprints
Protected land
Protected areas by protection type, or by the year they were acquired.
Real layers
Geology and aquifers
Geologic units or aquifers in their real order. Reverse the stacking order to put the oldest at the bottom.
Real layers
Archaeology
Excavation layers by phase or period.
Real layers
Airspace
Airspace classes by altitude band. Heights are for display, not true altitude.
Each record is one shape in one group. Data whose values change while the shapes stay the same, such as census counts on fixed tracts, reads better as a colour map with a time slider. Census boundary changes between counts do suit strata.
Make your own
Turn any polygon layer into strata.
Add a polygon layer, open its Advanced style, tick Show as a 3D chart and choose Temporal strata or Stacked footprints. Tilt the map to see the stack. It works on both map engines.